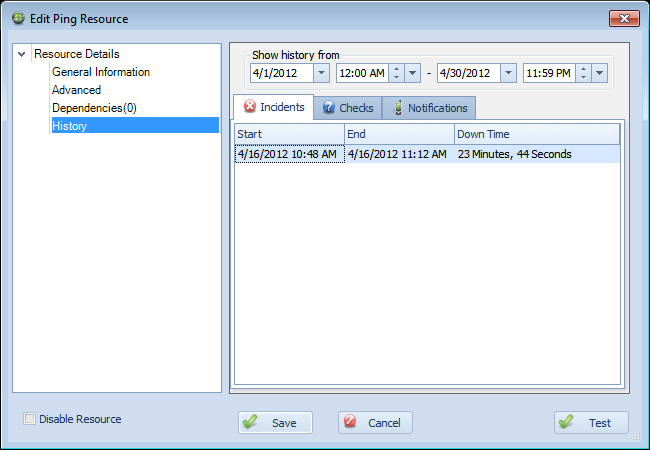
- Show history from: Setting the start date, start time, end date, and end time values here will filter the below areas(Incidents, Checks, and Notifications) to only include records within this time range.
- Start: This is the start time for the incident. This is the time that Overseer first detected this resource to be offline.
- End: This is the end time for the incident. This is the time that Overseer first detected this resource to come back online after failure. This might be blank, if the resource is currently in failure state, and this is the current incident.
- Down Time: This is the downtime that Overseer has observed for this resource. This will continue to rise if the incident is currently open(resource is still in failure).
See Also:
Copyright 2003-2012 Sensible Software, Inc. All Rights Reserved.
Network Monitoring Software